Bitcoin Mining Hash Rate Reaches New ATH
As pointed out by an analyst in a CryptoQuant post, the daily BTC mining hash rate has now achieved a new all-time high.
The “mining hash rate” is an indicator that measures the total amount of computing power present on the Bitcoin blockchain network.
The value of this metric may directly influence the performance of the chain. When the indicator has higher values, the network performs faster. Also, such values can imply that there are a lot of miners connected to the blockchain, which can lead to better decentralization of the crypto.
A higher degree of decentralization means that the security of the Bitcoin network is raised, and chances of malicious attacks become lower.
On the other hand, when the hash rate assumes low values, the network may perform poorly, and the security may also be lower.
Now, here is a chart that shows the trend in the value of this BTC indicator over the past year:
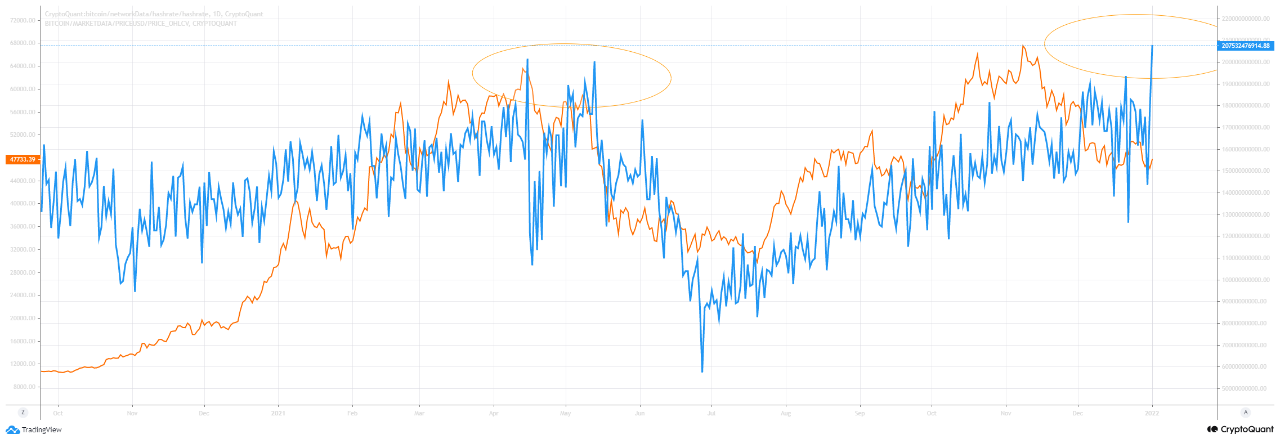 Looks like the metric has been trending up since a while | Source: CryptoQuant
As you can see in the above graph, the daily Bitcoin hash rate seems to have reached a new ATH just a couple of days back.
The last all-time high was achieved back in April, but due to China’s crackdowns on mining, the global hash rate took a hit in June, and subsequently made a bottom. However, since then, the indicator has been on a constant uptrend.
Usually, high hash rate values have been considered bullish in the BTC market since such values indicate that mining on the BTC network is currently quite profitable as more miners are being attracted to the chain (hence increasing the hash rate).
Therefore, the on-chain indicator setting a new ATH right now could turn out to bullish for the price of the cryptocurrency.
BTC Price
At the time of writing, Bitcoin’s price floats around $47.3k, down 7% in the last seven days. Over the past month, the crypto has lost 16% in value.
The below chart shows the trend in the price of BTC over the last five days.

BTC's price seems to have mostly moved sideways in the last few days | Source: BTCUSD on TradingView
Bitcoin gave investors a glimmer of hope as the crypto broke past $52k again a few days back, but the coin looks to have once more fallen back down into consolidation.
Disclaimer : The above empty space does not represent the position of this platform. If the content of the article is not logical or has irregularities, please submit feedback and we will delete or correct it, thank you!
COPYRIGHT © 2021-2023 HZD.COM & WWW.HZD.AI ALL RIGHTS RESERVED